When Anthony Davis was drafted with the first overall pick in the 2012 NBA Draft, it was expected that he would become an impact player on the defensive side of the court. A late growth spurt in high school resulted in a unique skillset not befitting a man of his size. After dominating in his lone season at the University of Kentucky, Davis moved onto the NBA, and most anticipated that he would have a very successful career, even if he did not produce at an All-League level immediately.
Well, we didn’t have to wait long. In only his second year in the NBA, Davis is already an All-Star and one of the most feared defensive players in the NBA. Davis uses his remarkable length and great sense of timing to block all kinds of shots, from dunks to 3-point attempts. Last season, Davis proved that he belonged in the NBA, but now he deserves to be called one of the best big men in the league. He leads the league in blocks per game at 3.1, half a block higher than any other player in the league.
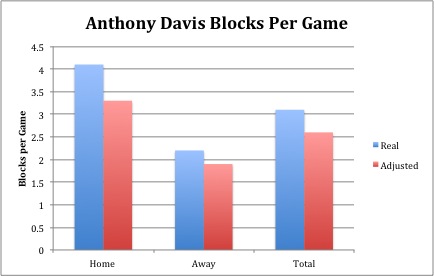
Davis, however, might be getting a little bit of help in the blocks category. But it’s not from his teammates or his coach. It’s from the Pelicans’ scorekeeper. Davis, as stated, is averaging a remarkable 3.1 blocks per game. At home, however, he is averaging 4.1 blocks per game. On the road? “Only” 2.2 blocks per game. Does Anthony Davis really play that much better at home, or could there be some statistical inflation going on here? It wouldn’t be the first time inflation of statistics has been a problem in the NBA, especially with subjective statistics that are more arbitrarily assigned like blocks and assists. It is quite plausible that Anthony Davis’s defensive success has been a product of a scorekeeper trying to help him out.
Anthony Davis is a tremendous shot blocker, but after watching footage of all of his blocks this season on nba.com, it’s hard to deny the fact that his home scorekeeper has been giving Davis a statistical boost. In determining how many blocks Anthony Davis really gets, I used two categories: true blocks, which are very clear cases of Anthony Davis blocking the shot, and questionable blocks, which includes instances where he did not block a shot but was given a block or the block was a questionable decision on the part of the scorekeeper. What I found was striking.
When the Pelicans are playing on the road, Anthony Davis blocks 2.2 shots per game. Of the 48 blocks Davis has recorded on the road, Davis has only had five questionable blocks, which means that about 10.6% of his blocks on the road are questionable. This error rate is not necessarily a cause for concern, for blocks are not always clear unless the statistician is physically on the court, which he is not. Furthermore, it can be hard to determine if a shot was blocked or simply altered, which does not count as a block. Adjusting his stats to exclude questionable blocks, Davis is averaging 1.9 blocks per game on the road.
At home though, his numbers are far different. Davis is averaging 4.1 blocks per game at home. This alone is a red flag, but could potentially be attributed to the fact that Davis might just play better at home. However, out of Davis’ 86 blocks at home, 19 of them fall into the questionable category. In this case, 23.2% of Davis’s blocks at home are not actually true blocks, much higher than the 10.6% on the road. If we adjust his stats to account for questionable blocks, Davis is only averaging 3.3 blocks per game at home. Adjusting his total number of blocks gives a grand total of 2.6 blocks per game, a half of a block lower than his current average.
After looking the adjusted totals, we still see that Davis is averaging more blocks at home than he is on the road. To add further proof to the inflation argument, however, one need not look any further than the how the Pelicans perform as a team when it comes to blocking shots.
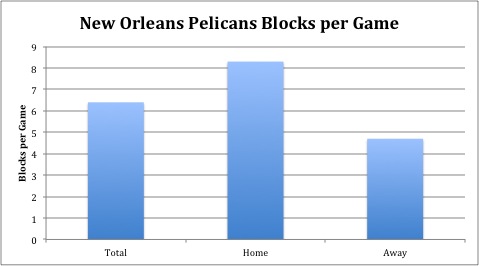
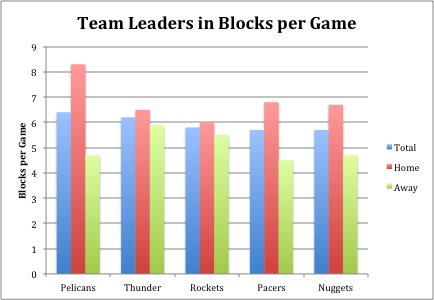
The numbers are staggering. The Pelicans block 6.4 shots per game, first in the NBA. On the road, however, the Pelicans are only averaging 4.7 blocks per game, almost 2 blocks lower than their average. And at home? 8.3 blocks per game, almost 2 blocks higher than their average. In total, this leads to a difference of almost 4 blocks per game between home and road games. It’s hard to believe that the Pelicans can almost double the number of blocks they get when they play at home versus when they play on the road. To add even more proof, let’s look at the five teams who lead the league in blocks per game.
In all five cases, teams average more blocks at home than they do on the road. For the Thunder and Rockets, this could be teams simply playing better at home, or minor stat inflation. In the cases of the Pacers and Nuggets, the difference between home and away is quite large. It is hard to imagine that a team could perform this much better in terms of blocking shots just by playing at home (although it is important to note that the Nuggets gain a huge advantage from Denver’s altitude). The Pelicans have the most drastic example of this, boasting the largest discrepancy in blocks between home and away games.
All this being said, there is still good reason for opposing teams to “fear the brow.” Davis is posting incredible numbers for a player only in his second season, and even after adjusting his blocks for inflation, Davis still would lead the league in blocks per game. This lead does not account for the possible inflation of stats for other top shot blockers, meaning that Davis could potentially be leading the league in blocks by an even larger margin than he is now. Even if we look skeptically at Davis’s stats due to inflation, we can still see qualitatively that Davis has already become a premier defensive player in the NBA.
Image courtesy of businessinsider.com
Data courtesy of nba.com
Connor Peterson
Georgetown University Class of 2017
Follow Connor on Twitter: @conorpeterson43
Follow GSABR on Twitter: @GtownSports
Like GSABR on Facebook


[…] Follow Connor on Twitter: @conorpeterson43 Follow GSABR on Twitter: @GtownSports Like GSABR on Facebook […]
[…] marketable star like Davis. Last season Connor Peterson of Georgetown Sports Analysis took a deep dive into the difference in Davis’ shot blocking prowess at home versus on the […]