Imagine you are the general manager for an MLB team today and are presented with a choice: Take either a top-hitting prospect or a top-pitching prospect—both equally regarded. With that information only, whom do you choose?
Theo Epstein and the Chicago Cubs
When Theo Epstein became the Chicago Cubs general manager in 2011, he inherited a barren farm system. ESPN.com prospect evaluator Keith Law selected just one Cubs prospect in his 2011 pre-season Top 100 list: Trey McNutt at number 66.
Today, the Cubs’ farm system is the envy of general managers. In MLB.com’s Midseason Top 100 list this summer, the Cubs placed seven top-100 players, including three in the top 10—Kris Bryant (3), Javier Baez (5), and Addison Russell (6).
While the MLB team under Epstein has certainly struggled, the Cubs have capitalized on top draft selections and trades to build a bright future, as this Grantland article discusses.
But why have the Cubs been so successful?
It could be luck—after all, it is extremely difficult to predict how a 17-year-old will develop. It could, however, also be the right approach coupled with execution.
Of the seven top 100 prospects, six are hitters. C.J. Edwards (56), acquired in the Matt Garza trade in July 2013, is the only pitcher. It appears to not just be a coincidence—the Cubs have targeted hitters in recent years. First round, top-10 picks SS Baez (2011), OF Albert Almora (2012), 3B Kris Bryant (2013), and C/OF Kyle Schwarber (2014) demonstrate a focus by the Cubs on acquiring top hitting talent. Even this summer, the Cubs received SS Russell and OF Billy McKinney (the Cubs current number 8 prospect) in a trade from the Athletics.
Josh Hamilton and Edinson Volquez
A few years before Epstein took over in Chicago, the Texas Rangers and Cincinnati Reds made a somewhat perplexing trade. Typically, teams move veterans for prospects or move players in packages to upgrade apparent needs.
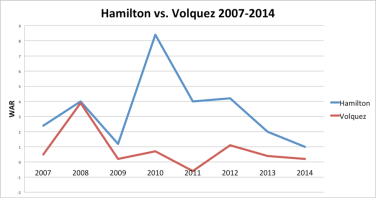
But in 2007, the Rangers and the Reds exchanged two emerging stars straight up: Josh Hamilton for Edinson Volquez (and throw-in Danny Herrera). One would expect teams to build around these guys, not trade them.
Regardless, looking back some seven years later, it is clear which team made the better deal. Despite Hamilton’s on-and-off injuries and off-the-field issues, he has been considerably more valuable than Volquez.
One was a pitcher (Volquez); the other, a hitter (Hamilton).
Hitting and Pitching Prospects
Are these two cases simply coincidental? Or is there a divide between hitting and pitching prospects? In this article, I analyze Wins-Above-Replacement (WAR) figures for top hitting and pitching prospects from 2002-2011.
But before such analysis, it is worth mentioning why this apparent divide is so crucial for today’s game. In almost all cases, MLB stars are former top prospects; however, not all top prospects become MLB players, let alone MLB stars. In short, there is an inherent risk or “game of luck” in selecting prospects. Further, the upside of developing a top prospect into a star is enormous—a top player, homegrown, at a cheap salary for multiple seasons.
As for the common notions about hitting and pitching prospects, typically, hitters are regarded as “safer.” They are generally easier to project and possess less inherent injury risk. Still, an ace pitcher cannot only carry a team, but can also lead a team to a championship. For these reasons, many teams seem to be evaluating prospects without a major focus on position—we like this player for x reasons. This approach is fair—clearly not all pitchers are the same, and not all hitters are the same.
But if there is an apparent widespread, underlying divide in value between hitting and pitching top prospects, the effect would be significant. It is possible that the Cubs have caught on to something.
Method
To analyze this relationship, I take the top 100 prospects, as determined by Baseball America, from 2002-2011 and compare their career and per-season WAR figures.
Why do I choose these years? Simply, this 10-year period reflects the latest, most current data regarding prospects. I stop at 2011 because it often takes prospects a couple of years to develop or reach the majors—hence, it would be hard to give a fair evaluation to prospects from 2012-present. By including players from 2002, I am able to capture the longevity factor for players of today’s era as well. (Yes, longevity is crucial for evaluating players—after all, a player’s value can only come from playing.) Further, by doing so, I am able to create a barometer to evaluate more recent prospects and determine any recent trends.
I will focus on two methods of evaluation—career WAR and per-season WAR. Career WAR is simply the total sum of WAR from each season the player has accumulated until today. Thus, older former top prospects should generally have significantly higher career WARs.
Per-season WAR is the average seasonal WAR figure for each player until now—however, I choose to add a “one-year grace period.” That is, when finding a player’s WAR average, I compute this number with one fewer year because, typically, top prospects require time to develop and are often not promoted right after they appear in the Baseball America list. Further, because 2014’s WAR stats are included, I count this season as ¾ of a season for computing the average (calculations were done ¾ of way through the season). It is worth noting that the effect of these determinations is almost none-existent as the calculations are the same for pitchers and hitters. Simply, having this data allows me to breakdown player skill levels in categories, as I will do shortly.
Additionally, for the many players that appear multiple times in Baseball America’s top 100 lists, I use their last year of appearance in Baseball America to determine their WAR average (when I start the clock on their evaluation).
Baseball America Rankings
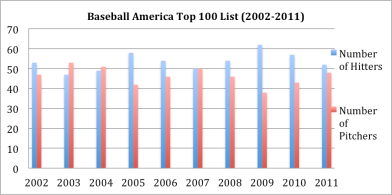
Before analyzing the data, it is helpful to know whom Baseball America is selecting in its annual Top 100 lists.
Baseball America seems to generally value pitchers and hitters equally—both are always well represented in the annual list and any fluctuations are likely due to the skill of prospects (not due to some overriding belief that one group of prospects fares better).
Prospect Data
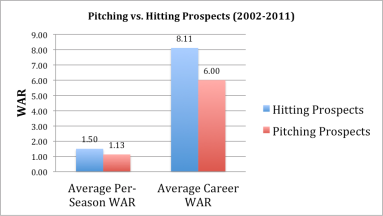
With that said, I turn to the general data. First, I compare hitters to pitchers for the whole time period (2002-2011). It is worth noting again that the career stats give more weight to older players, as they have more years of stat accumulation.
As the data demonstrate, hitting prospects clearly perform better in all aspects in this time period. Their career and per-season WAR figures are higher, and they appear to have more upside.
From Fangraphs, here is a breakdown of what the per-season WAR averages generally equate to, just to provide some context.
| Scrub | 0-1 WAR |
| Role Player | 1-2 WAR |
| Solid Starter | 2-3 WAR |
| Good Player | 3-4 WAR |
| All-Star | 4-5 WAR |
| Superstar | 5-6 WAR |
| MVP | 6+ WAR |
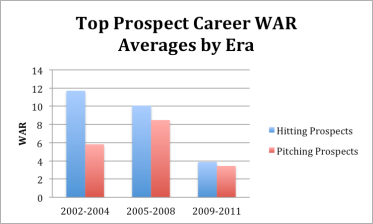
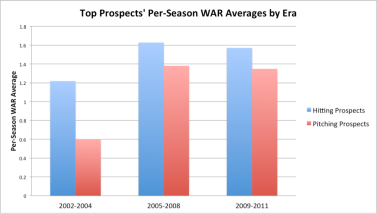
In each era, hitting prospects outperform pitching prospects. A few notes on this data. Top pitchers in 2002-2004 did not perform well, in part because more than 25% of them never reached the major leagues.
For the per-season data, it makes sense that the middle era has the highest averages, as players’ peak seasons are captured in the data. (For the early era, the peak seasons are accompanied by the decline after. And for the most recent era, many players have not entered their peaks, and some are still developing in the minor leagues.)
While the data appear clear, to investigate the data more closely, I now breakdown the data by era.
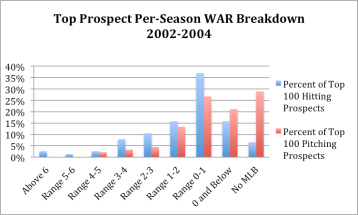
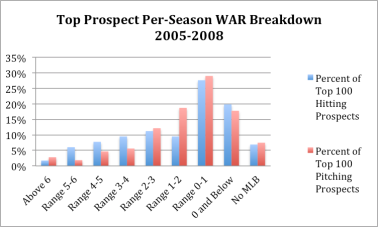
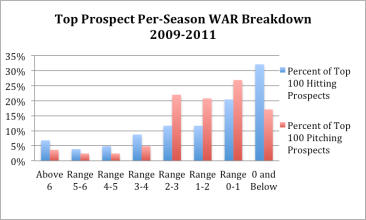
Again, across the board, hitters seem to be better bets. But perhaps pitchers have more upside? Here are the per-season WAR breakdowns by era.
Again, hitters appear better—with higher ceilings and higher floors. It is worth mentioning that with the 2009-2011 data, players who immediately entered the majors in 2011 have higher per-season WAR averages in general. This is because the one-year grace period has a larger effect the less amount of time a player has accumulated in the majors (or since his last Baseball America ranking in this case). However, this calculation is equal for pitchers and hitters, so the effect is minimal.
(For example, Desmond Jennings is listed as an “MVP-level” player on this list, even though most of the baseball community would not classify him as such. What is the explanation in this data? He appeared in Baseball America in 2011 and was promoted right away and has since put up decent WAR numbers.)
Still, many of these players could develop into MVPs (and some currently are).
Notably, the top-rated hitting prospects here are the following (in order of value and with last year of Baseball America appearance): Mike Trout (2011), Andrew McCutchen (2009), Buster Posey (2010), Jason Heyward (2010), Jennings (2011), Giancarlo Stanton (2010), and Freddie Freeman (2011).
And, for pitchers (in order of value and with last year of Baseball America appearance): Chris Sale (2011), Craig Kimbrel (2011), and David Price (2009).
The role of average MLB hitters and pitchers
With this data, one important question stands out: Yes, top hitting prospects may have higher WARs than top pitching prospects, but how do top prospects in each category compare to their respective MLB players? In short, how do top hitting prospects compare to average MLB hitters, and how do top pitching prospects compare to average MLB pitchers? After all, a team cannot just decide to play only batters or only pitchers—there has to be a mix.
I compute the average, per-season WAR values for all qualified hitters and pitchers from 2002-2014.
For MLB qualified players, pitchers on average actually post slightly higher per-season WARs (2.94 versus 2.85 for hitters), the key term is “qualified.”
Pitchers simply miss more time due to injury, and this appears to be the crux of the issue.
To capture this injury effect, I then look at the career average WAR values for all players who qualified in at least one season between 2002-2014.
While hitters average a lifetime WAR of 10.78, pitchers average only 8.90. What effect does this have on the above data? Well, it depends on the perspective one takes. To put pitching prospects in the best light, this could increase their value some because MLB pitchers on average have lower career WARs (and teams have to employ pitchers on their rosters). So, in essence, the bar may be lower for top pitching prospects.
Still, even with this mindset, top hitting prospects are slightly better relative to average MLB hitters than top pitching prospects are to average MLB pitchers.
Regardless, as I will discuss shortly, this last set of data should do more to encourage teams to invest in top hitting prospects, as it demonstrates the overlying issue with investing in top pitching prospects: frequency and magnitude of injury.
Conclusion
It is clear that, in general, hitting prospects are the better bet. As pitching continues to have the upper-hand in the majors, elite hitters should only rise in value.
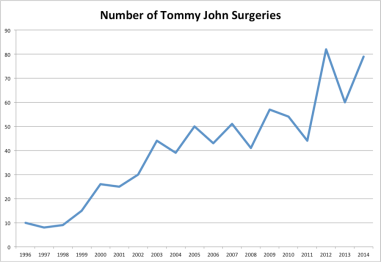
But it seems the ultimate crux to this divide lies in injuries. Pitchers (and especially young pitching prospects) simply get injured more. Below is a graph of the rising Tommy John surgeries conducted since 1995 to demonstrate this trend. 2014 has seen a lot of surgeries (Number of Tommy John Surgeries recorded as of late-August 2014.)
So, what would I advocate team do? It seems the general, best approach is to target top hitting prospects with high picks and as high returns in trades, while stockpiling young, high-upside pitchers at later rounds (with less investment per player). Teams simply cannot miss on high investments these days, but by selecting lots of high-upside pitchers in late draft rounds, for example, the investment risk is less. Many of those pitchers will likely never reach the majors or become average MLB players, but a couple likely will. And that’s all teams need—just a couple to pan out.
To expand on the apparent discrimination between career WAR figures for average MLB hitters and pitchers I discussed just above, this divide should further encourage teams to invest more in top hitting prospects. The bottom line is that teams typically retain young MLB players they developed in the minor leagues for many seasons—thus, the longevity factor is key. And as the data demonstrate, while MLB hitters and pitchers perform relatively equally when on the field, hitters stay on the field more.
In contrast, free agent signings can range in length but typically are shorter. And further, with free agent signings, teams have a better idea of whom they are getting—from past performance in the majors and from greater knowledge of a player’s injury risks.
Why does this matter? As I demonstrated above, there is no real divide between hitters and pitchers per-season. Simply, teams should invest where players are more valuable. Thus, I maintain the overlying best approach for teams is to focus their high prospect investments into hitters, while stockpiling many high-upside, low investment pitchers (in addition to targeting healthy MLB-level pitchers with shorter contract lengths via free agency and in trades to minimize the major downside of pitchers—injury).
Once again, the Cubs appear to be doing it right. Notably, the investment in former top Orioles pitching prospect Jake Arrieta, who initially struggled in the majors, has been successful. After posting a 5.46 ERA in parts of four seasons in Baltimore, with the Cubs this season, he has been one of the top pitchers in the majors, posting a 2.61 ERA to date. The investment was small, but the upside has been large.
In truth, only time will tell how successful the Cubs’ approach will be in the majors, but the future certainly appears bright.
WAR data from Fangraphs.com. Tommy John surgery data from BaseballHeatMaps.com. Prospect rankings data from Baseball America.
Image courtesy of chicagonow.com
Griffin Cohen
Georgetown University Class of 2017
Connect with Griffin on Linkedin: https://www.linkedin.com/pub/griffin-cohen/7a/b54/727
Follow GSABR on Twitter: @GtownSports
Like GSABR on Facebook
